

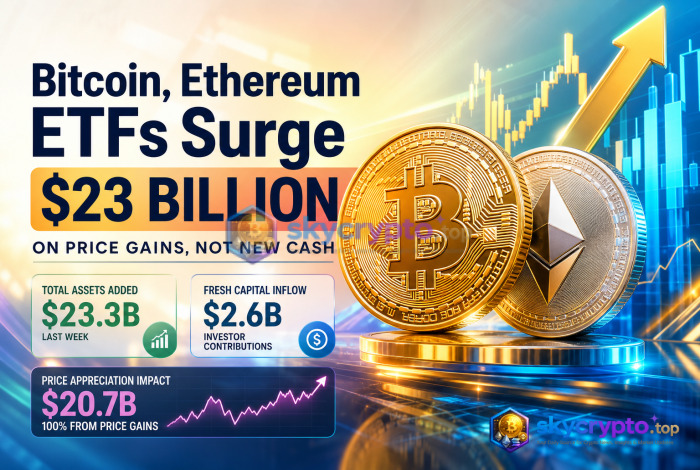
U.S. spot Bitcoin and Ethereum exchange-traded funds added $23.3 billion in total assets last week, yet investors contributed just $2.6 billion in fresh capital. The remaining $20.7 billion came entirely from price appreciation as Bitcoin rallied 24% to briefly top $79,000 and Ethereum surged 30% above $2,500. A short squeeze liquidating roughly $4 billion in bearish positions amplified the move.
- Combined ETF assets under management jumped $23.3 billion; net inflows accounted for only $2.6 billion.
- Bitcoin ETFs attracted $1.92 billion in net inflows, Ethereum funds $697.2 million — strongest week since October 2025.
- A short squeeze wiped out $3 billion in bearish bets within 24 hours, forcing cascading buybacks.
- BlackRock's IBIT captured 83% of daily Bitcoin fund flows at peak; XRP funds set record weekly volume of $271.74 million.
- Year-to-date combined deficit narrowed from $5.7 billion to $3.1 billion, but both categories remain in net outflow territory.
Market Reaction
Bitcoin's ascent from roughly $62,000 to an intraday peak above $79,000 marked its best weekly performance since 2023, a 24% gain that caught many positioning desks off guard. Ethereum mirrored the momentum, climbing from under $1,900 to clear $2,500 for a 30% advance. Trading volumes across spot and derivatives venues spiked, with perpetual futures open interest expanding rapidly as the short squeeze unfolded. The funding rate on major exchanges flipped deeply positive, reflecting aggressive long positioning and the cost of holding leveraged shorts through the volatility.
Trader sentiment shifted from cautious skepticism to outright euphoria within days. Options markets priced in elevated upside skew, with call buying overwhelming put demand for the first time in months. The CBOE Volatility Index for Bitcoin, a measure of expected 30-day swings, jumped above 80%, signaling expectations of continued turbulence. Retail participation metrics, including app download rankings and social-media mention volumes, surged to multi-month highs, though institutional order flow remained the dominant driver of the initial leg higher.
The speed of the move created technical damage on the downside. Key resistance levels at $68,000, $72,000, and $76,000 fell in rapid succession, each breach triggering algorithmic buy programs and stop-loss covering. By week's end, Bitcoin traded above its 200-day moving average for the first time since March, a level many quantitative models use as a regime filter. Ethereum reclaimed its own 200-day average near $2,400, reinforcing the bullish technical structure across the two largest crypto assets.
Why This Happened
Three distinct catalysts converged to ignite the rally. The most immediate macro driver came from the U.S. Treasury, which announced a doubling of its long-bond buyback program. By purchasing its own longer-dated debt, the Treasury aims to support demand and suppress term premiums, a move that weakens the dollar and lowers real yields. Lower real yields historically correlate with stronger Bitcoin performance, as the asset competes with Treasury Inflation-Protected Securities for inflation-hedge allocations. The dollar index fell 1.2% on the week, its sharpest decline since April.
Political developments added a regulatory tailwind. President Donald Trump hosted cryptocurrency executives at the White House and urged Congress to advance the Clarity Act, legislation designed to define jurisdictional boundaries between the SEC and CFTC for digital assets. While the bill faces an uncertain legislative calendar, the White House engagement signaled a shift in executive-branch posture that market participants interpreted as reducing the probability of enforcement-driven downside shocks. The meeting coincided with the SEC's decision to delay several spot ETF decisions, a procedural move that removed near-term regulatory overhang.
The third force — a violent short squeeze — did the most mechanical damage to bearish positioning. As Bitcoin broke above $70,000, an estimated $3 billion in short positions were liquidated within 24 hours, followed by another $1 billion the next day. Each forced buy order pushed prices higher, triggering the next tranche of liquidations in a self-reinforcing loop. Data from Coinglass showed the largest single-hour liquidation cluster since the March 2024 rally, with Binance and Bybit accounting for over 60% of the forced closures. The squeeze extended to Ethereum, where $800 million in shorts evaporated over the same period.
Institutional and Whale Activity
BlackRock's iShares Bitcoin Trust (IBIT) dominated the inflow landscape, at one point capturing 83 cents of every dollar entering Bitcoin funds in a single session. The fund's assets swelled to $42.3 billion, cementing its position as the largest crypto ETF globally. Fidelity's FBTC and Ark 21Shares' ARKB followed at a distance, with combined weekly inflows of $410 million. The concentration of flows into IBIT reflects institutional preference for the deepest liquidity pool and the tightest bid-ask spreads, which minimize execution slippage for large allocators.
On-chain analytics reveal that whale wallets — addresses holding more than 1,000 BTC — accumulated aggressively during the rally's early phase. Glassnode data shows a net increase of 42,000 BTC across these entities in the week ending August 21, the largest weekly accumulation since February. Exchange reserves continued their multi-year decline, dropping below 2.6 million BTC for the first time since 2018, suggesting reduced near-term selling pressure. Stablecoin supply on Ethereum, a proxy for dry powder, expanded by $2.1 billion, indicating fresh capital awaiting deployment.
Futures markets told a complementary story. CME Bitcoin futures open interest rose 18% to 145,000 contracts, the highest level since the March peak. The basis — the spread between futures and spot — widened to an annualized 14%, attracting cash-and-carry arbitrageurs who buy spot and sell futures to lock in the premium. This dynamic creates a structural bid in the physical market. Ethereum futures open interest on the CME jumped 22%, while the ETH basis reached 16% annualized, the widest since the Shanghai upgrade.
Historical Context
The current rally bears resemblance to the October 2023 breakout, when Bitcoin surged from $27,000 to $35,000 in two weeks on anticipation of spot ETF approvals. That move also featured a short squeeze liquidating $2.8 billion in bearish positions and was driven predominantly by price appreciation rather than inflows. The subsequent three months saw $15 billion in cumulative ETF inflows as institutional allocators moved from observation to allocation. The parallel suggests the current price-led advance could precede a sustained inflow cycle if the regulatory and macro backdrop remains supportive.
A more cautionary analogue appears in the July 2021 rally, when Bitcoin rebounded from $29,000 to $42,000 on short covering and retail euphoria, only to retrace 50% over the following two months as inflows failed to materialize. The critical difference this time is the existence of operational spot ETFs with proven plumbing, providing a persistent institutional on-ramp that did not exist in 2021. Additionally, the current macro environment — declining real yields, expanding fiscal deficits, and a Federal Reserve signaling rate cuts — aligns more favorably with Bitcoin's narrative as a non-sovereign store of value.
Ethereum's trajectory offers its own historical reference. The 35.9% weekly AUM increase for Ether ETFs exceeds the 28% gain seen during the May 2024 launch week, when novelty drove initial subscriptions. The current expansion occurs without the launch catalyst, suggesting organic demand growth. However, Ethereum ETFs remain in cumulative net outflow territory since inception, a distinction from Bitcoin funds which turned positive in April before reversing. The narrowing year-to-date deficit from $5.7 billion to $3.1 billion indicates healing, but the path to cumulative profitability remains distant.
What Traders Are Watching
- Bitcoin reclaim and hold above $78,500 — the 0.618 Fibonacci retracement of the March-to-July decline — to confirm bullish continuation toward the $84,000-$88,000 resistance zone.
- Ethereum sustain above $2,550, the neckline of a multi-month inverse head-and-shoulders pattern, with measured move targeting $3,200.
- CME futures basis compression below 10% annualized, signaling arbitrage unwind and potential spot selling pressure.
- Weekly ETF flow data for the period ending August 28; a second consecutive week above $2 billion combined inflows would signal institutional conviction beyond squeeze dynamics.
- U.S. CPI and PCE releases in early September; core inflation prints below 0.2% month-over-month would reinforce Fed easing expectations and risk-on sentiment.
Disclaimer: This article is provided for informational and educational purposes only and does not constitute financial, investment, or trading advice. Digital assets carry significant market risk.






Comments
You must be logged in to post a comment.
Login or Register